![]()
Notes on the Complexity of Measuring True Performance
Differences with DAW Stress Tests
©AGRONOVA/Anders
Fahlén
2006-01-18 First edition
| Page 1 of 3 »Technical Information Index |
![]()
Different DAW stress tests & configurations will not throttle your system in the same way
The original and Thonex II stress tests are known to throttle the DAW system harder (specifically in terms of VSTi/sample capacity) than e.g. the Sonar 3 test which should be taken into consideration. Case in point – the nForce4 with a single-core AMD 64 cpu may not act differently than other DAWs lacking the PCI-PCIe interconnectivity issue under light stress (Sonar 3, Five Tower), whereas performance differences start to become real when the PCI bus is throttled harder (Thonex, Thonex II).
Even different versions of drivers, DAW software and VSTIs will yield different stress test data – other variables kept constant. Thonex stress test data based on Nuendo 2 generally results in lower CPU loads than if based on the Nuendo 3.x version – all other factors kept constant. Different host software versions, as well as unstable systems, are known to yield varying or inconsistent CPU read off results and thus likely to cause skewed interpretations of the actual variable to be tested.
Stress test results will primarily mirror the mode of the test design itself and thus vary across different test platforms. From a user perspective, the important thing is to identify a test design which is a relevant reflection of real-world conditions likely to represent your DAW work (i.e. are you a hard hitter dependent on hundreds of audio tracks including a multitude of VSTi/samples, or rather dealing with multimedia work based on a limited number of audio/midi tracks ?).
![]()
Host/menu read-off latency vs. true latency in audio stress tests
When comparing DAW stress test data across various soundcards used, the reader should interpret any performance differences at a specific buffer setting cautiously as the soundcard’s menu latency setting may not reflect real I/O latency values. The German magazine, Keyboard (04/2005), measured the latency performance differences on seven Firewire soundcards and concluded that the discrepancies between indicated software latency values and real roundtrip latency ranged from 0 ms up to 7.1 ms. The RME Fireface 800 was the only tested device that did not differ (software indicated vs. real roundtrip values).
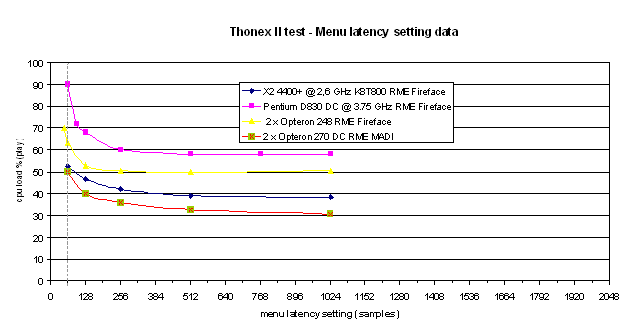
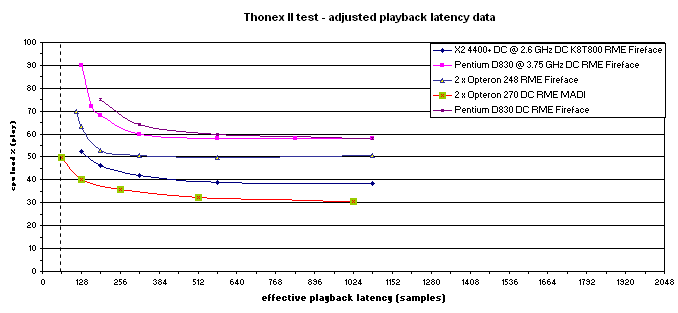
It is also important to note that Firewire soundcard interfaces usually include additional safety buffer latency in playback mode compared to PCI soundcards (this is needed as Firewire devices lack Direct Memory Access, DMA, as PCI devices). Thus, when comparing audio stress test data using playback mode with e.g. the RME Fireface it will add 64 samples latency via its safety buffer. If all other variables are kept constant the effective playback latency, RME HDSP PCI vs. RME Fireface 800, would actually add 1.5 ms (64 samples) at 44.1 kHz in the latter case. This effect is illustrated in the following figures:

Figure 1. Thonex II/Nuendo 3.1 stress test results: CPU loadvs.menu latency settings.
Average read off CPU load values (play). Input data based on user reports submitted to the Nuendo Hardware forum.

Figure 2. Thonex II/Nuendo 3.1 stress test results: CPU load vs.adjusted playback latency settings. Average read off CPU load values (play). Input data based on user reports submitted to the Nuendo Hardware forum. Average read off CPU load values (play).
Preferably, audio stress tests should be conducted with the same audio interface and driver version2 across mainboard/chipset/CPU platforms as to reduce such latency artifacts.![]()
2 buffer size information includes AD/DA conversion (1 + 1 ms) since RME Fireface driver 1.41 (11/2004); offset information increased by 1 sample since driver version 1.5 (12/2004). See http://www.rme-audio.com/.
![]()
Copyright © 2006 RME. All rights reserved.
RME is a registered trademark.
This website contains names and marks of other companies.
